
Uber Trips Analysis
About the data
January 2016- December 2016
Unit of analysis : Drives
Total Drives : 1,155
Total Miles : 12,204
Dataset: The dataset contains Start Date, End Date, Start Location, End Location, Miles Driven and Purpose of drive (Business, Personal, Meals, Errands, Meetings, Customer Support etc.)
References and Acknowledgements
“Zeeshan-ul-hassan Usmani, My Uber Drives Dataset, Kaggle Dataset Repository, March 23, 2017.”
Uber Trips Analysis
Analysis of customer behaviour from the Uber trips in 2016
The business problem that we wanted to solve is "How to increase/encourage use of Uber? "
Data Cleaning
Data was cleaned and visualised using pandas, numpy, datetime, matplot, seaborn
'Start date' was used to extract Hour, day, day of the week , Month and Year for analysis. Total travel time was computed using 'End date' and 'Start Date'
Analysis
Graphs visualised using matplot
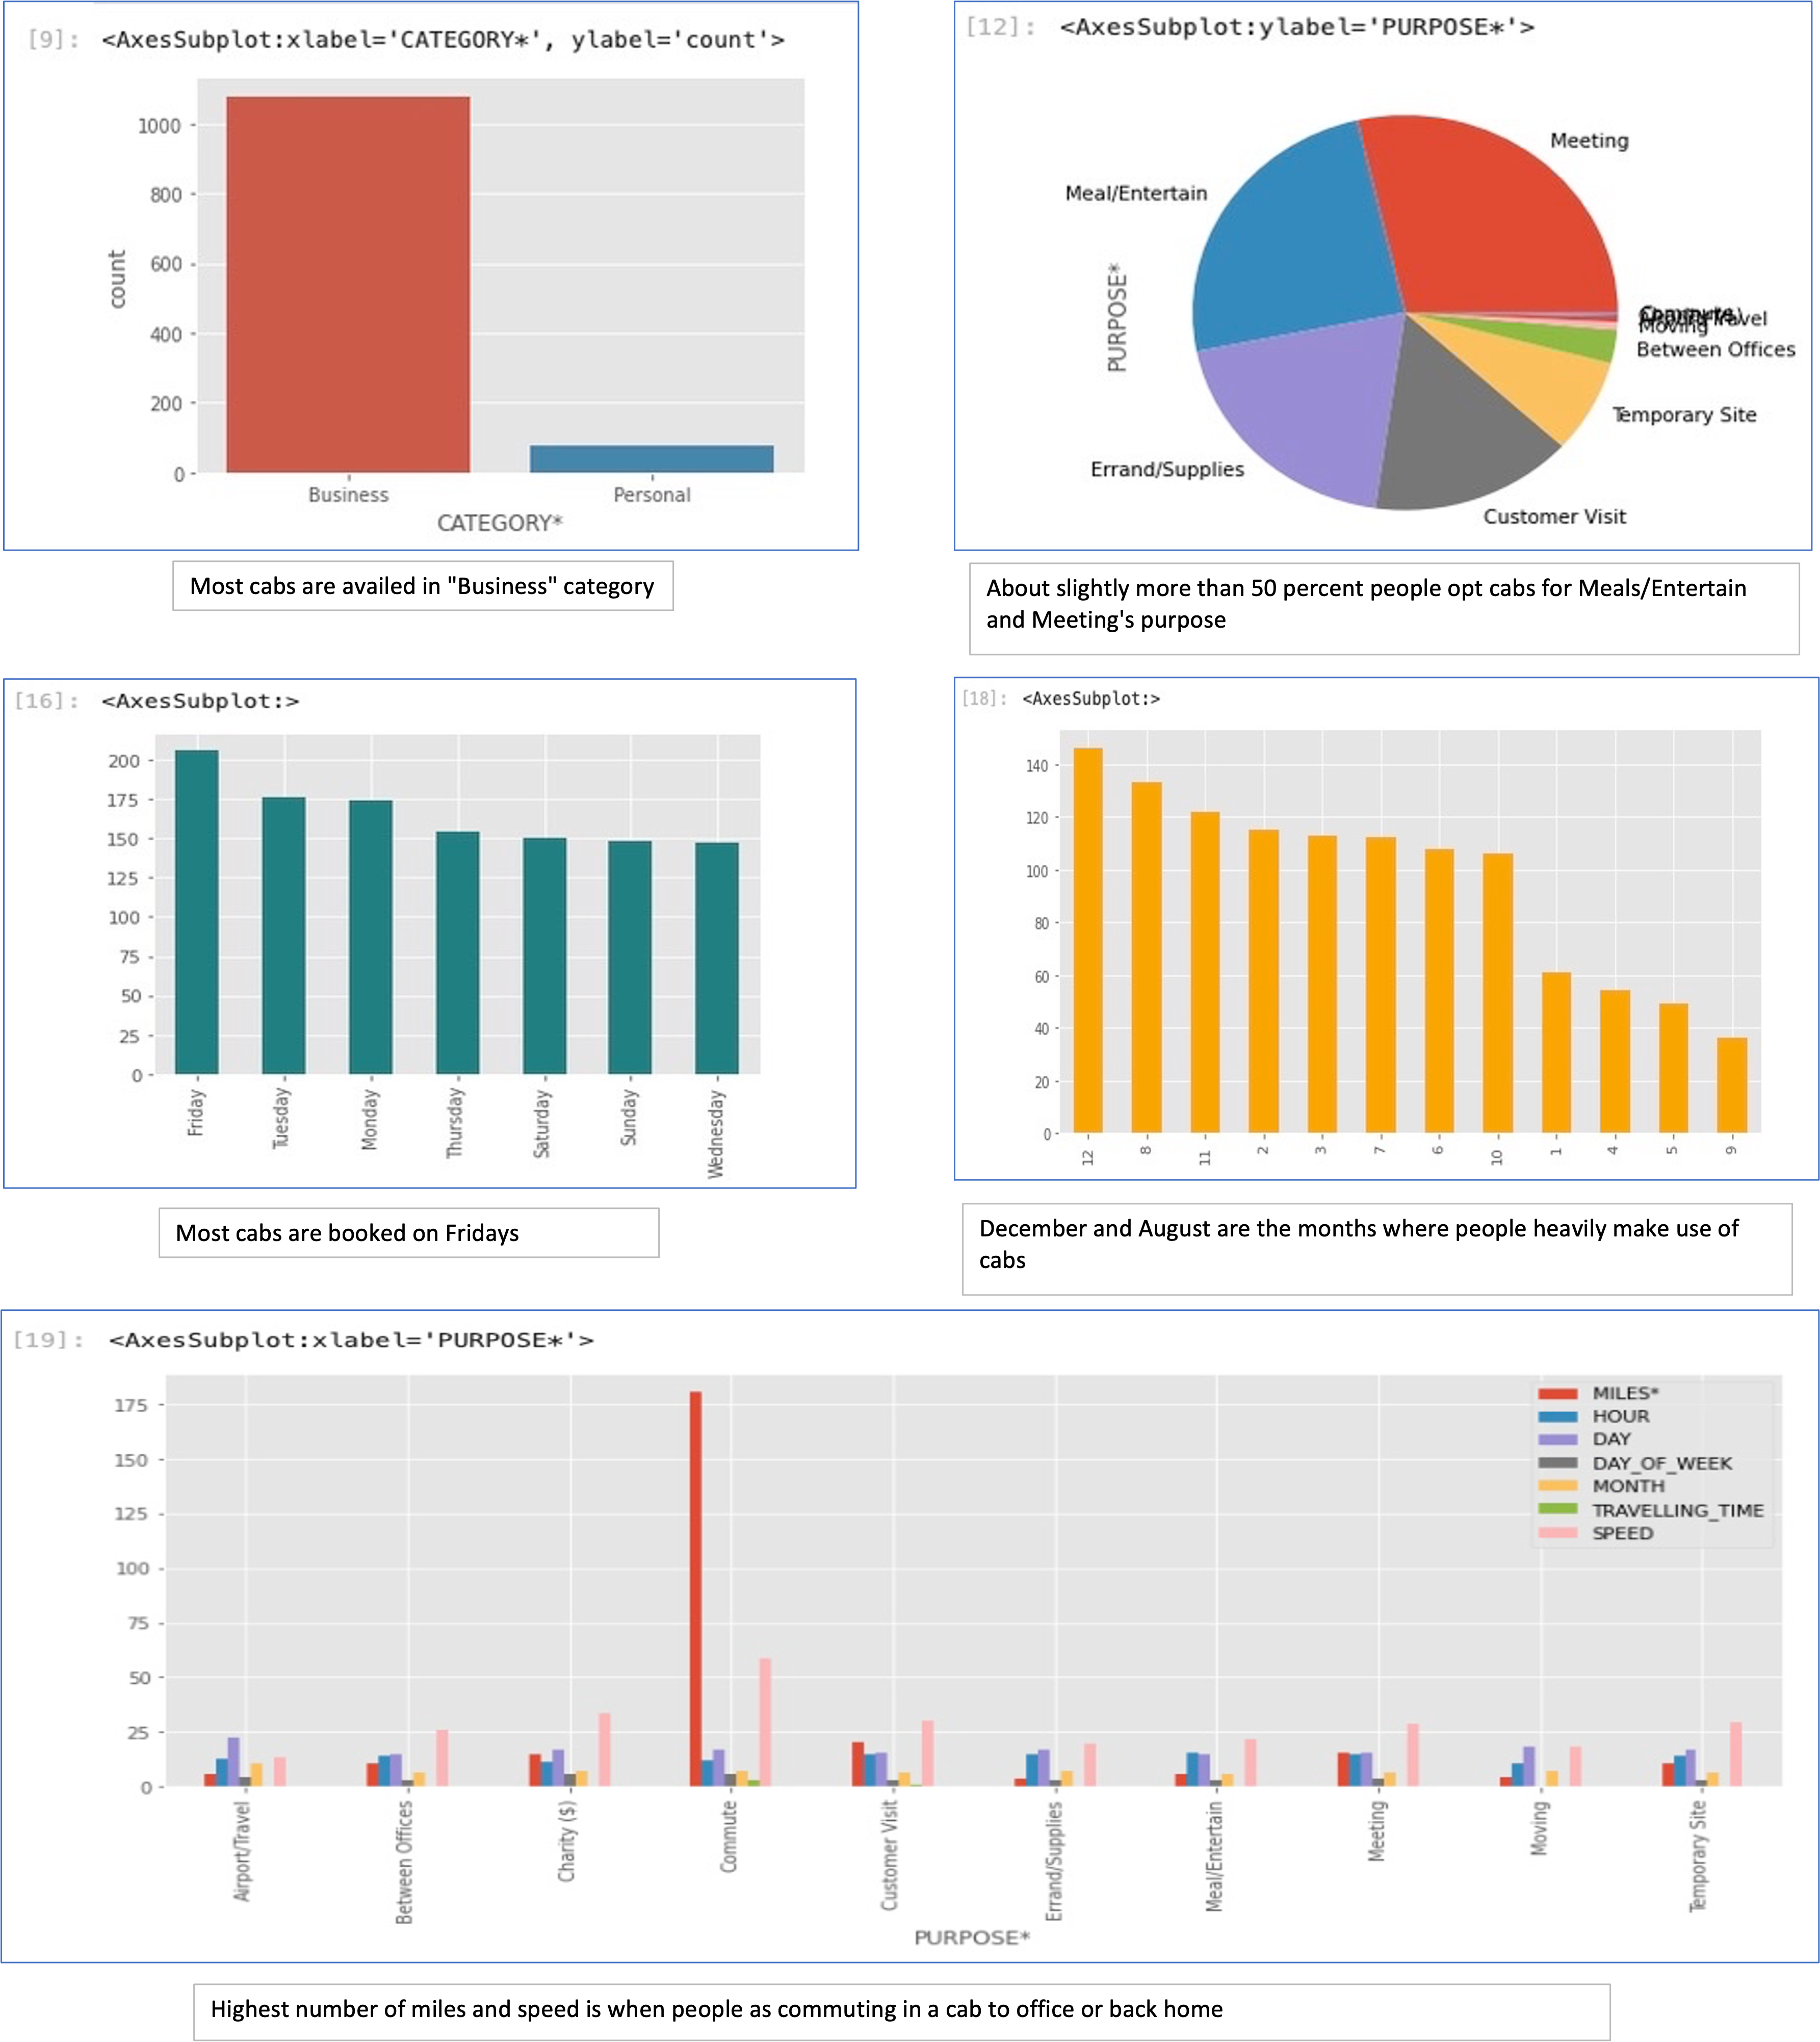
Looking at this analysis quantitatively, we can infer that highest number of cabs are availed on a friday in December and August. Most cabs are used for business. Meetings and meals/entertain having the highest purpose of calling a cab. Basis this, we can qualitatively say that Business Meetings or Team building activities carried out on Fridays can be benefitted by some offers like "BOGO on bowling!" or "20% off on lunch". Providing such incentives/offers to customers can increase/encourage the use of cabs. December being the coldest month and August being rainy, if we deploy more cabs in these months, the sales would likely be better!